How to Use a Moving Average to Buy Stocks
Investing in stocks can be tricky, especially when trying to decide the right time to buy. One of the most effective tools traders use is the moving average. Whether you’re a beginner or an experienced investor, understanding how moving averages work can help you make smarter investment decisions. In this guide, we’ll break down what a moving average is, how to use it, and how it can improve your stock trading strategy.
What is a Moving Average?
A moving average (MA) is a stock market indicator that helps smooth out price fluctuations by averaging past prices over a specific period. It allows traders to identify trends and make informed buy or sell decisions.
There are two main types of moving averages:
- Simple Moving Average (SMA): This is calculated by adding up the closing prices over a set period and dividing by the number of periods.
- Exponential Moving Average (EMA): This gives more weight to recent prices, making it more responsive to price changes.
Why Use Moving Averages for Stock Trading?
Using moving averages helps traders:
✅ Identify trends early
✅ Reduce market noise
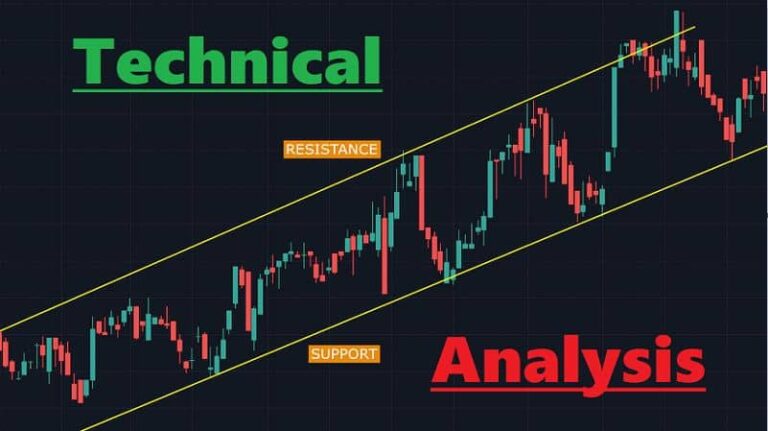
✅ Determine support and resistance levels
✅ Make data-driven decisions
How to Use a Moving Average to Buy Stocks
1. Identify the Trend
The first step is to determine whether a stock is in an uptrend or a downtrend using moving averages.
- If the stock price is above the moving average, it usually indicates an uptrend (bullish signal).
- If the stock price is below the moving average, it signals a downtrend (bearish signal).
For example, if a stock consistently trades above its 50-day moving average, it suggests a strong trend, making it a good buying opportunity.
2. Use the Moving Average Crossover Strategy
One of the most powerful strategies is the moving average crossover. This happens when a short-term moving average crosses a long-term moving average, indicating a potential buy or sell signal.
🔹 Golden Cross (Buy Signal): When the 50-day MA crosses above the 200-day MA, it signals a strong upward trend.
🔹 Death Cross (Sell Signal): When the 50-day MA crosses below the 200-day MA, it suggests a downtrend.
3. Buy at Support Levels
Moving averages often act as support levels where stock prices tend to bounce back.
- If a stock price falls close to its 50-day or 200-day moving average and holds, it may be a good buying opportunity.
- Traders often set stop-loss orders below the moving average to minimize risk in case the trend reverses.
4. Use Moving Averages with Other Indicators
While moving averages are useful, they work best when combined with other technical indicators like:
- Relative Strength Index (RSI): Helps confirm if a stock is overbought or oversold.
- MACD (Moving Average Convergence Divergence): Measures momentum and trend strength.
- Volume Analysis: Helps verify if the trend is strong.
5. Choosing the Right Moving Average Period
The choice of moving average depends on your trading style:
📊 Short-term traders (Day traders & Swing traders)
- Use 9-day, 20-day, or 50-day moving averages for quick buy and sell signals.
📊 Long-term investors
- Use 100-day or 200-day moving averages for more reliable trend confirmation.
Common Mistakes to Avoid When Using Moving Averages
🚫 Relying Only on Moving Averages – Always combine with other indicators.
🚫 Ignoring Market Conditions – Moving averages work best in trending markets, not sideways markets.
🚫 Using the Wrong Time Frame – Choose a moving average period that matches your investment horizon.
Final Thoughts
Moving averages are powerful tools for buying stocks, but they’re not foolproof. They help traders identify trends, confirm entry points, and manage risks. By combining moving averages with other indicators, you can improve your chances of making profitable trades.
Start experimenting with different moving averages on your favorite stocks, and see which strategy works best for you!
FAQs
1. Which moving average is best for buying stocks?
The 50-day and 200-day moving averages are the most commonly used for buying stocks. Short-term traders may prefer the 9-day or 20-day MA.
2. What is the best time frame for a moving average?
It depends on your trading style. Short-term traders use 9-day or 20-day MAs, while long-term investors use 100-day or 200-day MAs.
3. Can moving averages predict stock prices?
Moving averages cannot predict prices, but they help identify trends and potential buy/sell opportunities.
4. How do I use the golden cross strategy?
A golden cross occurs when the 50-day moving average crosses above the 200-day moving average, signaling a strong bullish trend and a good buy opportunity.
5. Should I use SMA or EMA for trading?
SMA is better for long-term trend analysis, while EMA is better for short-term trading due to its responsiveness to recent price changes.